Experiment conducted on October 7, 2024
This lab journal serves as a personal record of experimental work and learning experiences. Some experimental details, procedures, and results have been simplified or omitted. This content is intended for personal documentation purposes only and should not be used as a reference for scientific work or experimental procedures.Overview
This experiment focused on determining ethanol content in alcoholic beverages using gas chromatography with an internal standard method. Using an Agilent GC-7820a with FID and a J&W Scientific DB-WAXETER column, we aimed to quantify ethanol content and compare it with labeled values. The analysis employed 2-butanol as an internal standard and utilised both response factor and calibration curve methods for quantification.
Method
Standards were prepared according to Table 1 using varying concentrations of ethanol (1-5 v/v%) with 2-butanol as internal standard.
Table 1: Pipetting schedule for preparation of ethanol standards
in 100 mL volumetric flasks
| Standard | Ethanol (mL) | 2-butanol (mL) | Final Ethanol concentration (v/v%) |
| 1 | 1 | 3 | 1 |
| 2 | 2 | 3 | 2 |
| 3 | 3 | 3 | 3 |
| 4 | 4 | 3 | 4 |
| 5 | 5 | 3 | 5 |
Due to an instrument malfunction (ALS Failure Code 945), a provided dataset for Sarmentino Cabernet Sauvignon wine (labeled 13.0% v/v ethanol) was analysed. Two quantification approaches were employed: the response factor method and the calibration curve method. The calibration curve was constructed by plotting peak area ratios (ethanol/2-butanol) against known ethanol concentrations.
Results
To determine the ethanol content in the wine sample, a standard series with known concentration of ethanol and 2-butanol was measured. The peak areas for both compounds are recorded in Table 2.
Table 2: Standard series with ethanol and 2-butanol as the internal standard,
and their measured peak areas using GC.
| Standard | Ethanol concentration (v/v%) | 2-butanol concentration (v/v%) | Peak Area (ethanol) | Peak Area (butanol) | Ratio (Aethanol / A2-butanol) |
| 1 | 1 | 3 | 673.071 | 2616.797 | 0.257 |
| 2 | 2 | 3 | 1290.444 | 2599.055 | 0.497 |
| 3 | 3 | 3 | 1859.293 | 2453.858 | 0.758 |
| 4 | 4 | 3 | 2547.776 | 2550.787 | 0.999 |
| 5 | 5 | 3 | 3171.084 | 2524.488 | 1.256 |
The ethanol content was determined using two methods as follows:
1. Response Factor (F) Method
The response factor F accounts for differences in detector response between ethanol and the internal standard 2-butanol. The response factor was calculated as 0.7577 by using standard 3, which contains 3% (v/v) ethanol and 3% (v/v) 2-butanol.
\[F = \left( \frac{A_{\text{ethanol}}}{A_{\text{2-butanol}}} \right) \times \left( \frac{C_{\text{2-butanol}}}{C_{\text{ethanol}}} \right) = \left( \frac{1859{.}293}{2453{.}858} \right) \times \left( \frac{3\%}{3\%} \right) = 0.7577\]The ethanol concentration in each wine sample was calculated using the response factor and multiplied by the dilution factor (D = 4), since 25 mL of wine was diluted to 100 mL. The ethanol concentration in the wine samples was determined to be 10.9% (v/v) with a standard deviation of 0.6% and a coefficient of variation of 5.9%.
2. Calibration Curve Method
A calibration curve was constructed by plotting the ratio of the peak areas of ethanol to 2-butanol against the known ethanol concentrations of the standards. The calibration curve exhibited an R2 value of 0.9998, indicating a strong linear relationship. The equation obtained was:
\[y = {0.25x + 0.0032}\]where y represents the peak area ratio (Aethanol / A2-butanol) and x represents the ethanol concentration (v/v%).
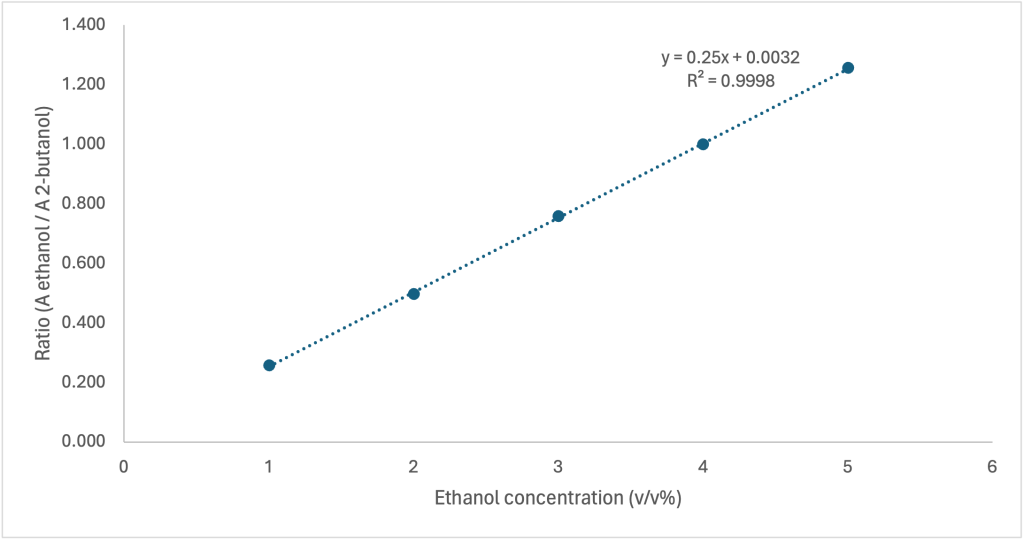
Figure 1: Standard curve of standard series which the ratio of peak areas of ethanol and 2-butanol plotted as the function of ethanol concentration (v/v%)
Using the calibration curve, the ethanol content of the wine samples was determined to be 11.0% (v/v) with a standard deviation of 0.6% and a coefficient of variation of 5.9%,.
Leave a Reply